.svg)


Where do you stand?
McKinsey’s foundational article “How to be great at people analytics” offers a helpful matrix to locate your current stage.
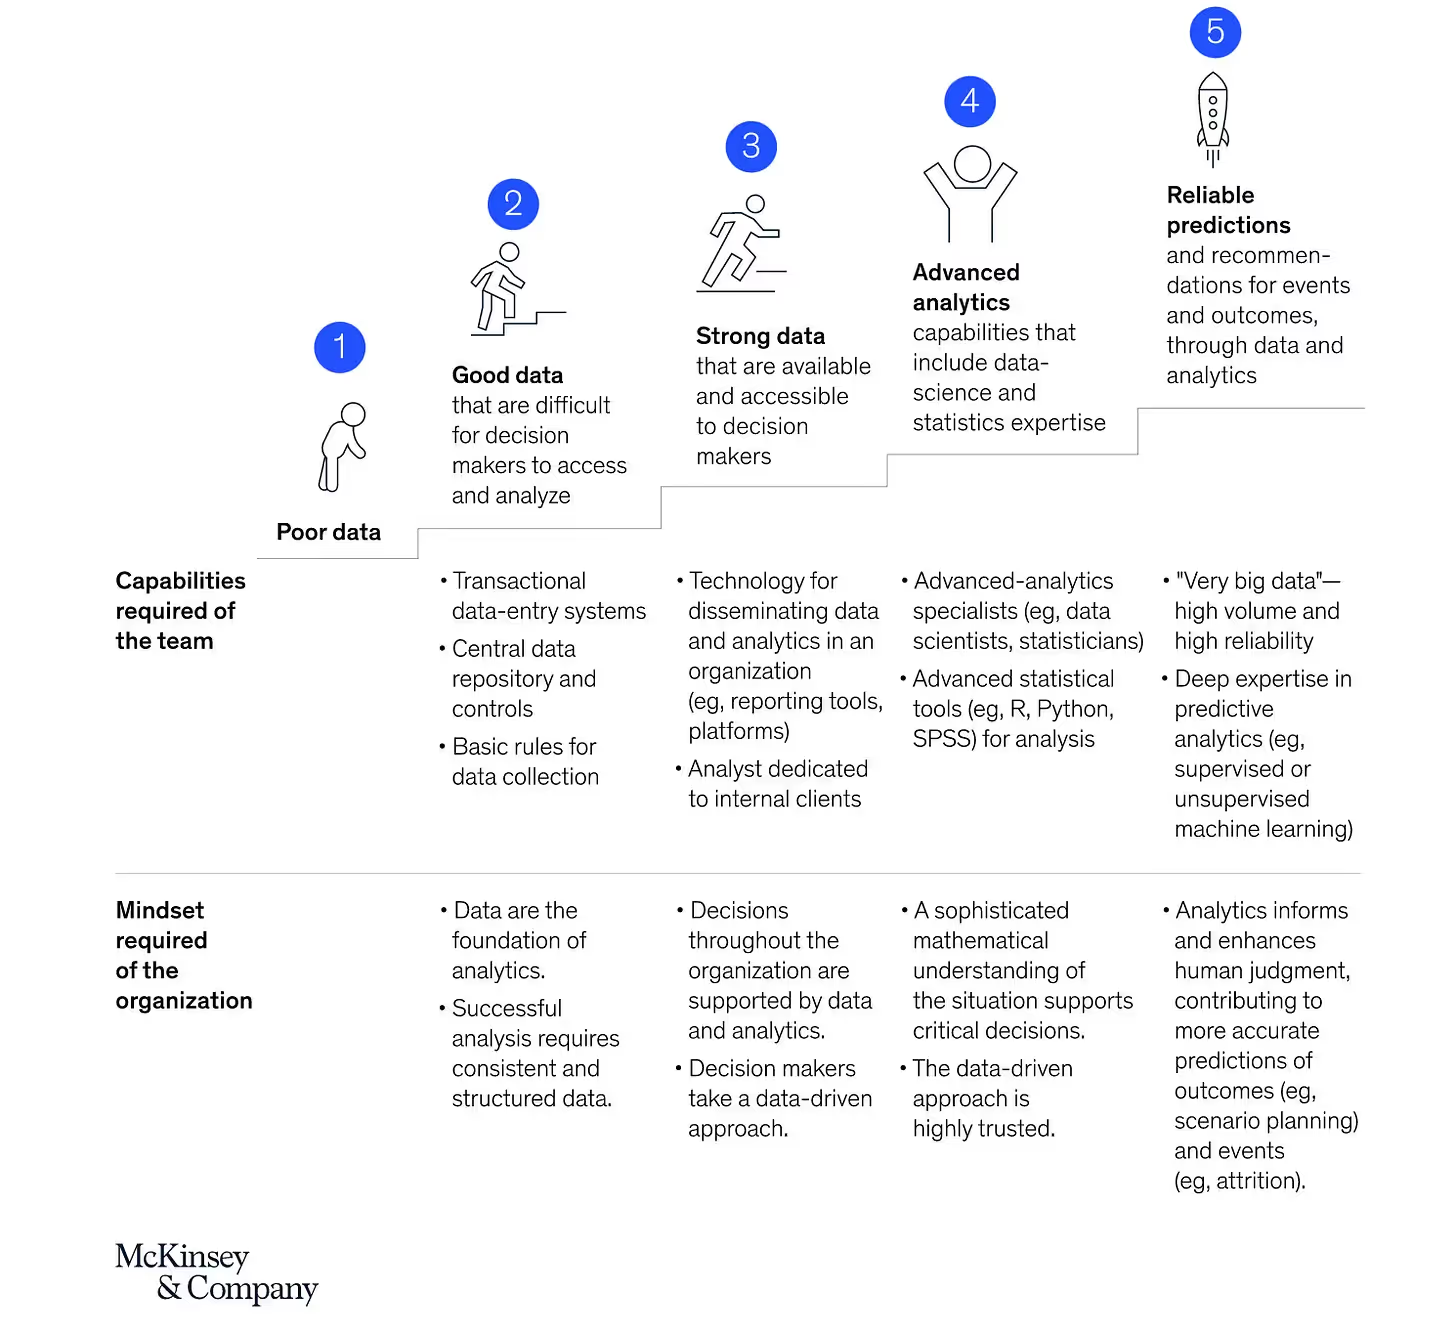
Stage 1: Poor data
Characteristics:
- No HR software
- No data governance policy
- Low‑quality, inconsistent data
How to reach Stage 2
- Implement core HR tools: ATS for recruiting, HRIS, payroll, performance, learning, and eNPS/climate surveys
- Adopt a clean, organized approach to data collection
Stage 2: Good data
Characteristics:
- You’re becoming data‑driven and see the need to track data more precisely
- Access and analysis are still difficult and ad‑hoc
Observation:
- Most SMEs and mid‑market companies (up to ~5,000 employees) are here—motivation is high, but processes and reporting have gaps
How to reach Stage 3
- Deploy reporting and analytics technologies
Two paths:
- Build internally (Excel or BI tools)
- Use a specialized solution like Reflect
Stage 3: Strong data
Characteristics:
- Dashboards and indicators are reliable, accessible, actionable, automated—and shareable
Sharing matters:
- Data sensitivity is a real HR constraint. At this stage, share relevant indicators with stakeholders (executives, Works Council/CSE, employees, investors) for their respective scopes.
How to reach Stage 4
Once you’ve mastered automated, descriptive reporting, you can develop advanced analytics.
Stage 5: Reliable predictions
Reality check:
- McKinsey experts rarely see teams fully succeed at this last stage. It requires big data, machine learning, and predictive modeling at scale.
Aim:
- Extremely granular analysis of massive datasets to recommend precise actions.
Example:
- “Increase Paul’s salary by €1,200 and move him to Sales under Caroline Jean; otherwise, he is likely to leave in eight months.”
Partager cet article sur
Make smarter decisions with Reflect.
%2520(1).avif)
.avif)